
Key takeaways
- An xApp in the near-RT RIC changed the gNB's per-slice resource ratios over E2SM-CCC. Under congestion, a high-priority user receiving a constant 2 Mb/s went from a p95 round-trip time of about 3.4 to 5 seconds to about 215 to 350 ms, with all traffic delivered and no packet loss.
- The problem was almost invisible in throughput. The user still received about 90 percent of its traffic, but the missing 10 percent built up in the gNB's downlink buffer and added roughly 0.1 seconds of delay for every second of congestion. Measuring on the user's device is what showed it.
- Protection was not free. Capping the best-effort slice freed about 12 resource blocks, of which the high-priority user needed about 2, and about 10 stayed unused. How the minimum and maximum ratios interact in this gNB is the next thing we will test.
- In this test the ratios were switched at a fixed time by the test harness. The next step is an rApp that switches them ahead of a predicted busy period, which would also allow the cost of predictive protection to be compared with keeping protection on all the time.
Background
The Ericsson blog post "Why AI and telecom hold the key to the future of human connection" (October 2026) argues that networks will increasingly be judged by whether the person on the other end feels present, and names slicing and differentiated connectivity among the building blocks that already exist. For immersive and interactive services, that depends less on throughput than on delay that stays low and stable.
In our lab we tested one part of this. An xApp in the near-RT RIC changes how the gNB's scheduler divides the cell's radio resources between slices, so that the scheduler itself protects a high-priority user's slice. The question is simple: when a cell is congested, can changing the per-slice resource ratios keep a high-priority user's traffic flowing without delay building up?
The lab setup
The lab runs on open-source software: an open5gs core, a gNB based on the srsRAN Project in RF simulation mode, OAI UEs and the FlexRIC near-RT RIC, with Prometheus and Grafana for observation. The cell has 51 physical resource blocks (PRBs). Four UEs are attached, and three of them are active in the test:
- A high-priority user, which we call VIP, on its own slice (SST 2), receiving a constant 2 Mb/s UDP download.
- Two best-effort users on another slice (SST 1), each receiving an 8 Mb/s UDP download. Together they ask for far more than the cell can carry, so the cell is congested.
The SST values are used here only as labels for the two slices. In 3GPP TS 23.501, SST 1 and SST 2 are the standardised values for eMBB and URLLC; we do not rely on that meaning in this test.
The slices' shares of the cell are set as minimum and maximum percentages of its resource blocks. These correspond to the 3GPP RRM policy attributes rRMPolicyMinRatio and rRMPolicyMaxRatio (TS 28.541). An xApp in the near-RT RIC sends them to the gNB over E2SM-CCC. The two test phases differ only in these ratios:
- Baseline ratios: best-effort slice minimum 40 percent, maximum 60 percent; VIP slice minimum 45 percent, maximum 100 percent.
- Protective ratios: best-effort slice minimum 15 percent, maximum 40 percent; VIP slice minimum 80 percent, maximum 100 percent.
The baseline is a configured set of ratios, not the absence of a configuration and not the gNB's default. In this lab the gNB starts with the protective ratios, and the test harness restores them after each run. What the test compares is two slice configurations.
The gNB also accepts per-UE limits over E2SM-RC, but in this gNB those only bound the size of each UE's grants and do not change the slice shares. They are not used here. Before each run, the harness resets them to neutral values and checks that the gNB acknowledged them, so the slice ratios are the only difference between the two phases.
How we measured
Every run follows the same sequence. Traffic starts with the baseline ratios for about 40 seconds, the protective ratios are then applied for about a minute, and finally the harness restores the default ratios and stops the traffic.
The VIP's experience is measured on the VIP's own device. A ping and a reverse-mode iperf session run on the VIP UE for the whole run without restarting, so there is no setup effect when the ratios change. The delay figures in this post are ping round-trip times. Bytes per UE are also read from the UEs' tunnel interfaces. The RAN's own view, PRBs granted per UE, comes from KPM reports collected by the RIC every five seconds.
A validation script compares every chart on the dashboard with independent sources after each run: the raw ping files, the tunnel counters and the downlink scheduling entries in the gNB log. The charts and these sources have to agree within a few percent, and the time of the switch has to match within five seconds. The KPM-based PRB chart lags by up to about nine seconds because of the five-second collection interval, and the KPM figures are about 2 PRB per UE higher than the gNB log, with the same shape.
When the protective ratios are applied, the VIP first has to receive the traffic that queued up during the baseline phase. That takes 12 to 18 seconds. The protected-phase statistics therefore start 20 seconds after the switch, so the queue drain is not counted as protected performance.
With the baseline ratios: throughput looks fine, delay does not
Figure 1 shows the phases of one run: orange is the baseline phase, green is the protected phase, and blue is the restore phase at the end. The other figures use the same time axis.

With the baseline ratios, the VIP receives about 1.8 Mb/s of the 2 Mb/s sent to it (Figure 4). In a throughput chart that looks like a small shortfall. Figure 2 shows what it means for delay: the VIP's round-trip time rises steadily from about 100 ms to around 4 seconds before the ratios change.
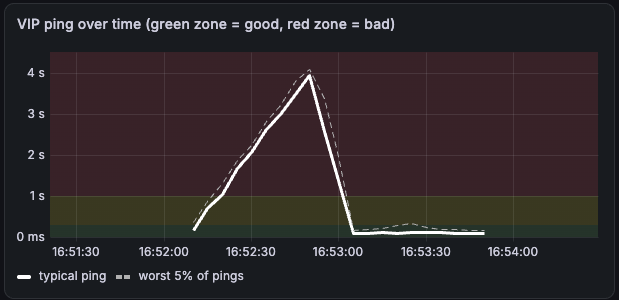
The reason is simple arithmetic. The source sends at a constant 2 Mb/s and does not slow down. If the cell delivers only about 1.76 Mb/s, about 0.24 Mb/s is added to the gNB's downlink buffer every second. Sending that backlog at 1.76 Mb/s takes about 0.14 seconds more for every second that passes, so the delay grows by roughly 0.1 seconds per second of congestion. Over the 40-second baseline phase this adds up to several seconds. There is no packet loss, because the buffer never fills during the phase.
This is the main point of the measurement. A throughput or loss-based view of the cell would report a VIP receiving about 90 percent of its traffic with no loss. The user would experience several seconds of delay.
With the protective ratios: the scheduler shifts resources between slices
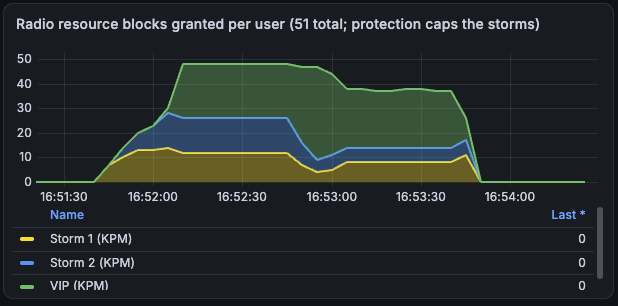
When the protective ratios are applied, the scheduler changes how it divides the cell between the two slices. Figure 3 shows the RAN's view: the best-effort users' combined share drops from about 26 to 28 PRBs to about 14, within a few seconds of the new ratios reaching the gNB. The VIP's share rises only slightly, from about 20 to 22 PRBs to about 24.
That small increase is enough. Figure 4 shows the VIP's download rate: a short peak of about 2.7 Mb/s while the queued backlog is delivered, followed by a steady 2.00 Mb/s. That is exactly what the source sends. The scheduler is not enforcing a 2 Mb/s rate; it is simply no longer holding any of the VIP's traffic back.
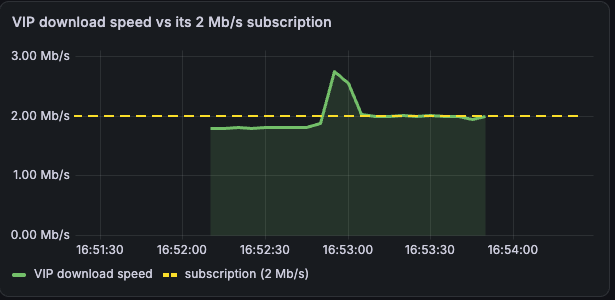
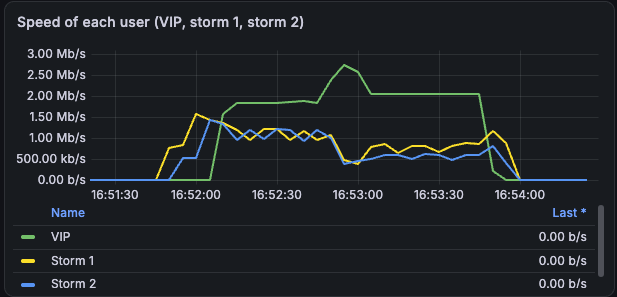
Figure 5 shows all three users together. Before the switch, the two best-effort users and the VIP compete for the cell. After the switch, the best-effort users drop to well under 1 Mb/s each, and the VIP's line is the flat one.
Once the backlog has drained, the VIP's round-trip time stays at a few hundred milliseconds for the rest of the protected phase (Figure 2).
Results across repeated runs
We repeated the full sequence 18 times, with consistent results:
- Baseline ratios: VIP p95 round-trip time of about 3.4 to 5 seconds at the end of the 40-second phase, about 1.8 Mb/s of the 2 Mb/s delivered.
- Protective ratios: VIP p95 round-trip time of about 215 to 350 ms, 2.00 Mb/s delivered (within 0.01 Mb/s in every run), and no packet loss.
- Queue drain after the switch: 12 to 18 seconds.
In the most recent run, for example, the baseline p95 was 4.86 seconds and the protected p95 was 235 ms. The best-effort slice used about 26 PRBs (51 percent of the cell) with the baseline ratios and about 14 (27 percent) with the protective ratios.
What the numbers do not show
Several limits apply to these results.
The baseline delay depends on how long the baseline phase lasts. The queue grows for as long as the shortfall continues, so a longer phase would report a higher p95. The growth rate, roughly 0.1 seconds of delay per second of congestion, is the figure that does not depend on test length. A much longer phase would eventually fill the buffer and cause loss instead of growing further.
The protected delay is not a guarantee against a target. We did not define a delay target for this test, and the protected p95 of 215 to 350 ms is a measured round-trip time, not the 3GPP packet delay budget, which is a one-way bound between the UE and the core network.
Protection leaves capacity unused. Capping the best-effort slice frees about 12 PRBs, the VIP uses about 2 of them, and about 10 stay idle (Figure 3). A guaranteed minimum for the VIP slice, rather than a maximum on the best-effort slice, could protect the VIP without this waste. However, the baseline ratios already give the VIP slice a 45 percent minimum, about 23 PRBs, and the VIP still received fewer, so the minimum ratio in this gNB does not act as a hard guarantee.
The configured ratios are not reached exactly. With a 60 percent maximum (30 PRBs), the best-effort slice received about 26; with a 40 percent maximum (20 PRBs), about 14. The results show the direction and size of the effect, not exact ratio enforcement. One explanation we will test is that the VIP slice's minimum is partly reserved even when the VIP does not use it: in both phases, the best-effort share is closer to "100 percent minus the VIP minimum" than to its own maximum. If that holds, it would explain both the idle PRBs and the unreached maximum. The test is to keep the best-effort maximum fixed and vary only the VIP minimum.
The test covers one kind of problem: a capacity shortfall that builds a queue. With three background users instead of two, we have also seen a different pattern in this lab, where the protected UE is served at irregular intervals that add about 10 ms of delay. Static slice settings did not change that pattern, and this test does not address it.
Finally, the scope: one simulated cell running at about 1/1.6 of real time, with four attached UEs. This is a lab demonstration, not a field result.
How this relates to the wider picture, and what comes next
The Ericsson post describes networks that predict degradation and reconfigure themselves, built on slicing and differentiated connectivity. This test covers one small part of that, on simulated radio: protecting a slice through the gNB scheduler, configured from the near-RT RIC. The result comes from measurements on the user's device and shows a broken experience with no packet loss and throughput that looks almost normal, which is why we measure commitments on delay. It is a long way from the latency targets and scale that such services will need, but it shows the control loop working end to end.
The other part, reconfiguring before degradation, is not covered here: the switch is triggered by the test harness at a fixed time. The next step is an rApp in the Non-RT RIC that applies the protective ratios ahead of a predicted busy period, using the application's session schedule and the cell's history, with the baseline ratios as the default. Because the best-effort traffic in this setup also runs before and after the protected period, that test can also show whether predictive protection costs less than keeping protection on all the time.
References
- Ericsson, Why AI and telecom hold the key to the future of human connection, Ericsson blog, 15 October 2026
- 3GPP TS 28.541, Management and orchestration; 5G Network Resource Model (NRM)
- 3GPP TS 23.501, System architecture for the 5G System (5GS)
- R1, A1, E2, O1: a practical map of who talks to whom in O-RAN